
Using testing software to deliver exams, often includes the opportunity to run statistical analysis on the items (questions). Review this information allows for refinement of the assessment items and in turn improves the performance of the test.
Item Discrimination Index
Item Discrimination Index (point-biserial correlation coefficient) is a common method to determine the affect of an item on the internal consistency of the test. It is an indicator of the degree that an item differentiates students who score high on a test from those that score low on the test total. A high discrimination value is an indicator of reliability. This indicates an items consistency with the test as a whole. So, a low value would indicate an item is inconsistant with the test and reduces reliability. This value is directly tied to the Item Difficulty Index and should be review with the Difficulty value of the item.
The possible range of the discrimination index is -1.0 to 1.0. Negative value items should be omitted are inconsistent with the test and should be omitted and as a general rule items < .30 should be reviewed
The Item Discrimination is included in the statistical reports of both Blackboard and TurningPoint software. To manually calculate this statistic, you must first determine the following and then Discrimination index can be computed with the formula below:
- Total number of students that answered the item correctly
- Total number of students that answered the item incorrectly.
- Mean total score of the group of students that have answered the item correctly
- Mean total score of the group of students that answered the item incorrectly
- Mean total score of all active students
- Standard Deviation (σ) = √(Σ((x – μ)²) / n) where (x = a students’ score, μ = mean total score, and n = total number of students)
Discrimination index = ((Mp-Mq) / σ) * √((Np*Nq)/((Np+Nq) * (Np+Nq-1))
- Mp = mean total score of the group of students that answered the item correctly
- Mq = mean total score of the group of students that answered the item incorrectly
- Np = total number of students that answered the item correctly
- Nq = total number of students that answered the item incorrectly
- ? = standard deviation of scores for the entire set
Item Difficulty Index
Item Difficulty Index is the proportion of students that answered the item correctly on the test. For example if 20 students take the test and 15 students correctly answer an items the Difficulty Index (p) value would be 0.75 (p=15/20). This measure is sometimes referred to as the “item easiness” because it describe the percentage of correct responses.
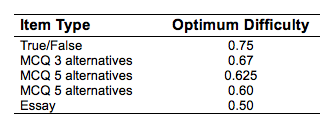
Optimal difficulty values are listed below that would produce a normal distribution of grades. But if grades were a normal distribution a large portion of the students would fail. Thus, a more applicable rule of thumb is a average difficulty index value of > 0.70.
The Difficulty Index is calculated using the following formula: D = c / n
- D = Difficulty Index
- c = Number of participants that answered the question correctly
- n = Total number of active participants
Distractor Analysis
Distractor Analysis can be conducted by reviewing the frequency of each of the distractors of an item. This would include items with poor performance (p < 0.30) or items were distractor are so off base few or no students selected them. This process can also identify items that may have been miskeyed (correct answer incorrectly marked) on the test.
References
Furr, R. M., & Bacharach, V. R. (2013). Psychometrics. SAGE. http://doi.org/10.1111/j.1399-0012.2012.01647.x
Hopkins, K. D. (1998). Educational and psychological measurement and evaluation. Boston : Allyn & Bacon.
Wright, R. J. (2008). Educational Assessment. SAGE Publications.